- Cardiac blood pressures (measured via Swan-Ganz catheterization)
- Right atrium: < 5 mm Hg
- Right ventricle (pulmonary artery pressure): 25/5 mm Hg
- During systole, pressures in the right ventricle are much lower than in the left ventricle (only ~25 mm Hg compared to ~120 mm Hg). As a result, coronary perfusion pressure is able to overcome right ventricular wall pressure throughout the cardiac cycle, leading to relatively constant blood flow to the right ventricular myocardium.
- Left atrium (pulmonary capillary wedge pressure): < 12 mm Hg (higher than left ventricular pressure in mitral stenosis)
- Left ventricle: 130/10 mm Hg
- Coronary perfusion pressure
- The driving pressure that forces blood into the coronary arteries during diastole
- Calculated as the difference in pressure between the aorta and left ventricle during diastole
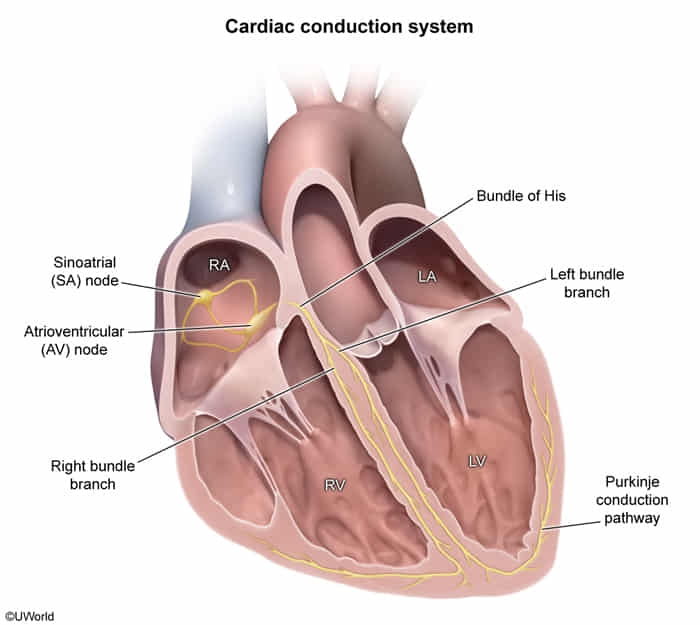
Cardiac Conduction System
| Component | Location | Intrinsic Rate (bpm) | Conduction Velocity (m/s) |
|---|---|---|---|
| SA Node | Upper wall of the right atrium at the junction with the SVC. | 60-100 (Primary Pacemaker) | ~0.5 |
| Atrial Myocardium | Spreads from SA node across both atria. | N/A | ~1.0 |
| AV Node | Interatrial septum, near the opening of the coronary sinus. | 40-60 (Secondary Pacemaker) | ~0.05 (Slowest) |
| Bundle of His | Continuation of the AV node; travels through the interventricular septum. | 40-60 | ~2.0 |
| Bundle Branches | Right and Left branches within the interventricular septum. | 20-40 | ~2.0 |
| Purkinje Fibers | Subendocardial surface of the ventricular walls. | ~20-40 (Tertiary Pacemaker) | ~4.0 (Fastest) |
| Ventricular Myocardium | Spreads from Purkinje fibers throughout the ventricles. | N/A | ~0.3-0.5 |
Triangle of Koch: Small anatomical region within the atrioventricular septum superior to the coronary sinus. The AV node is located at its apex.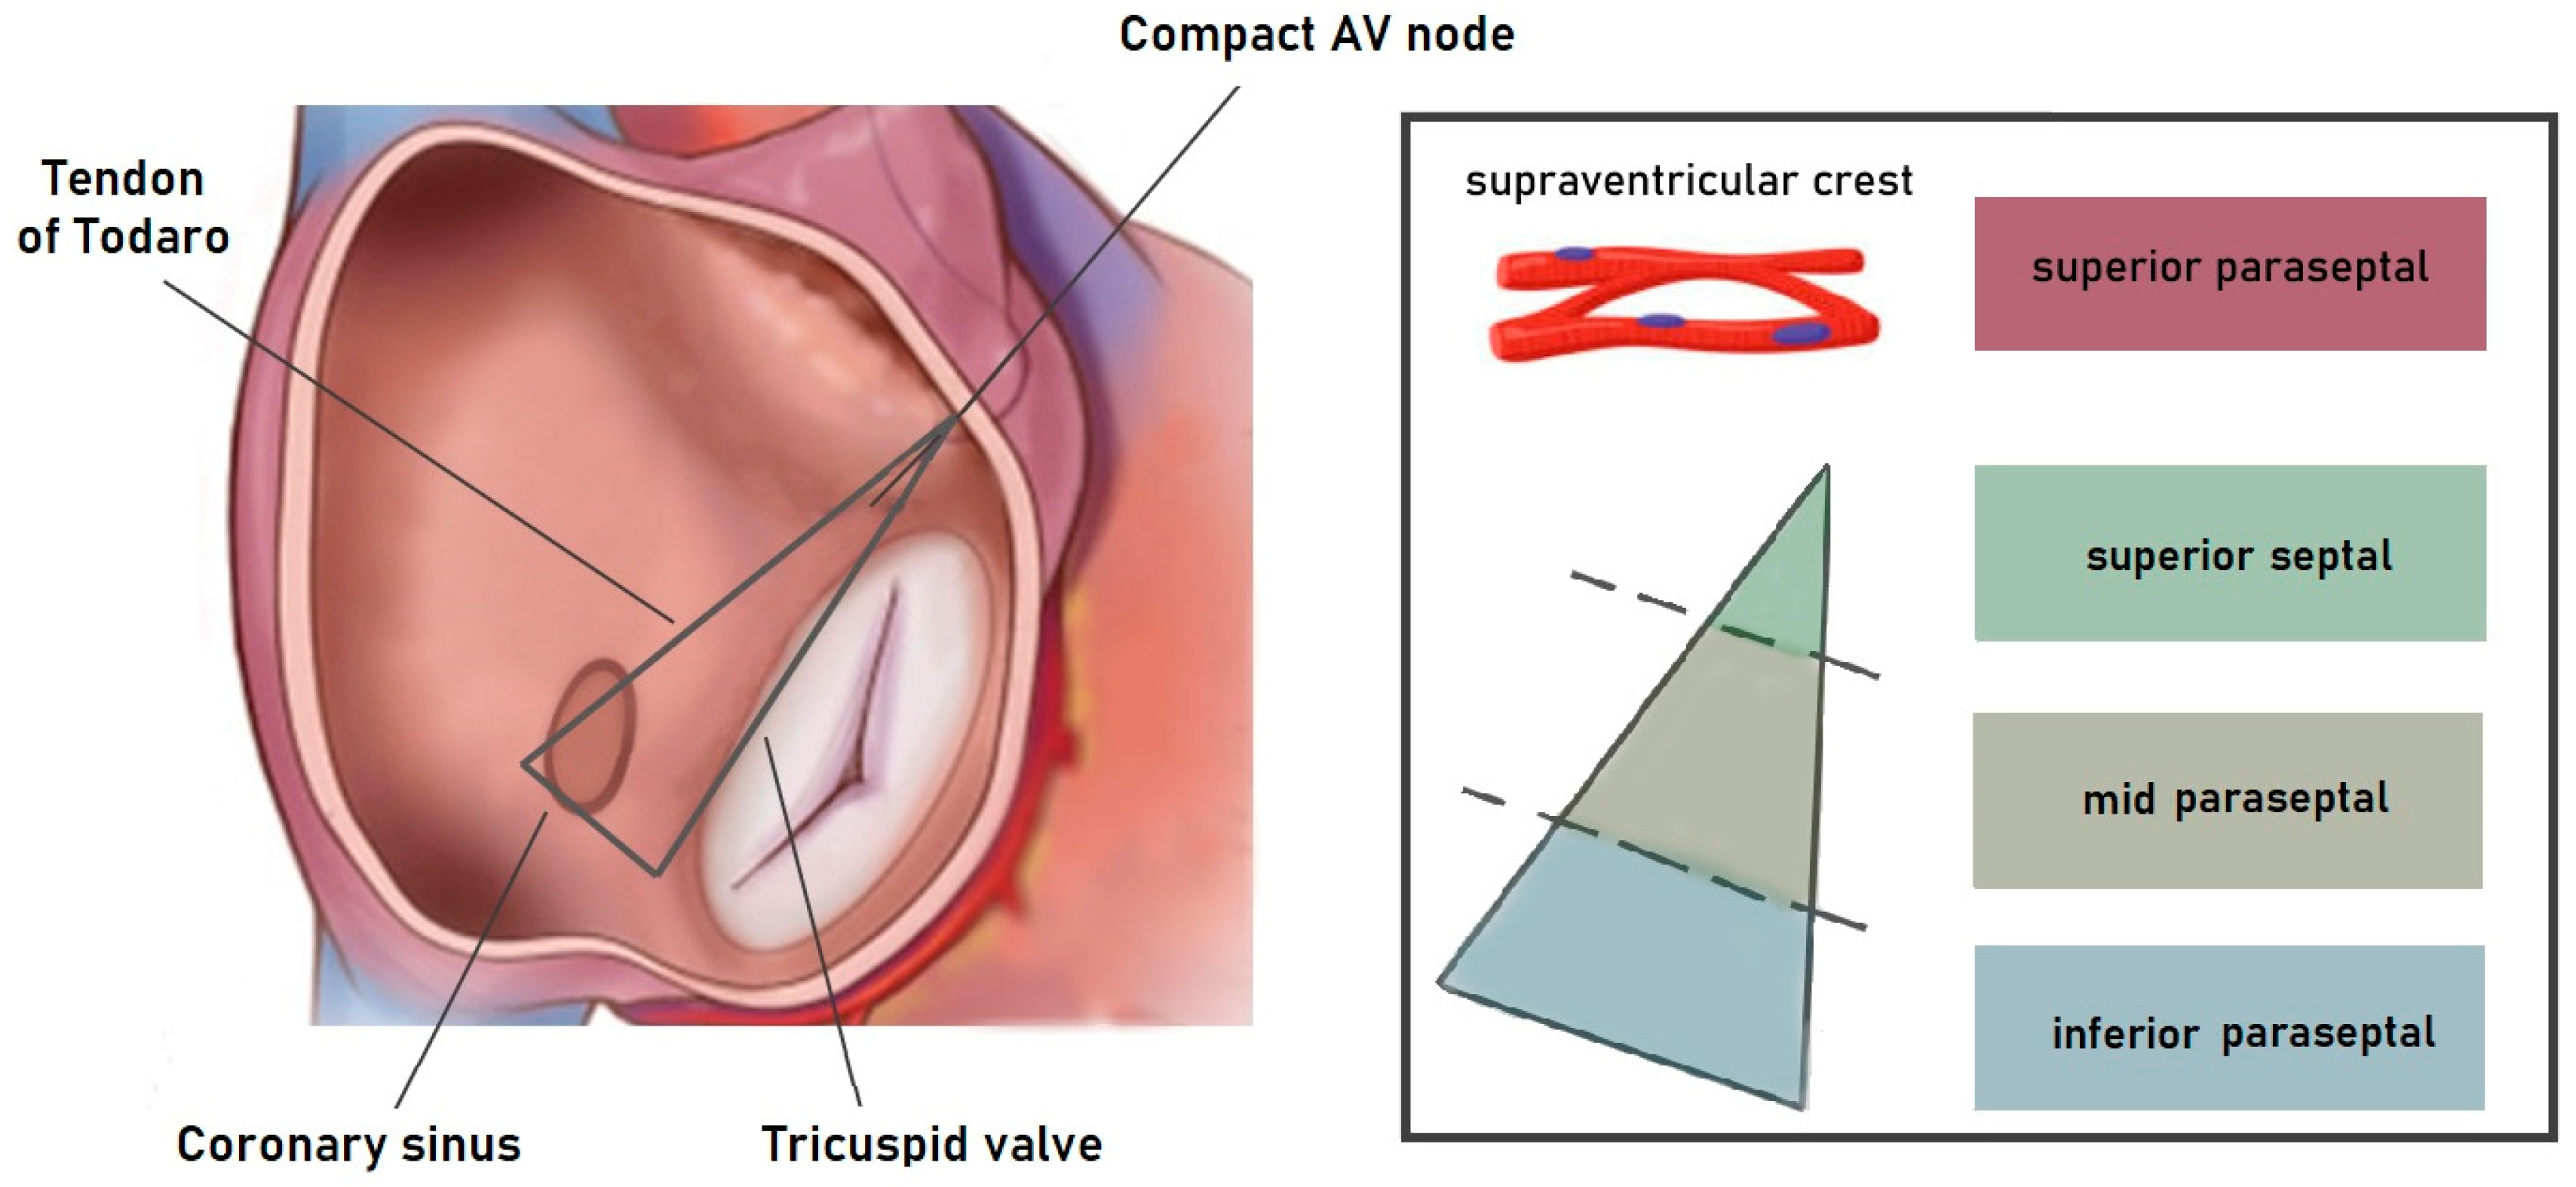
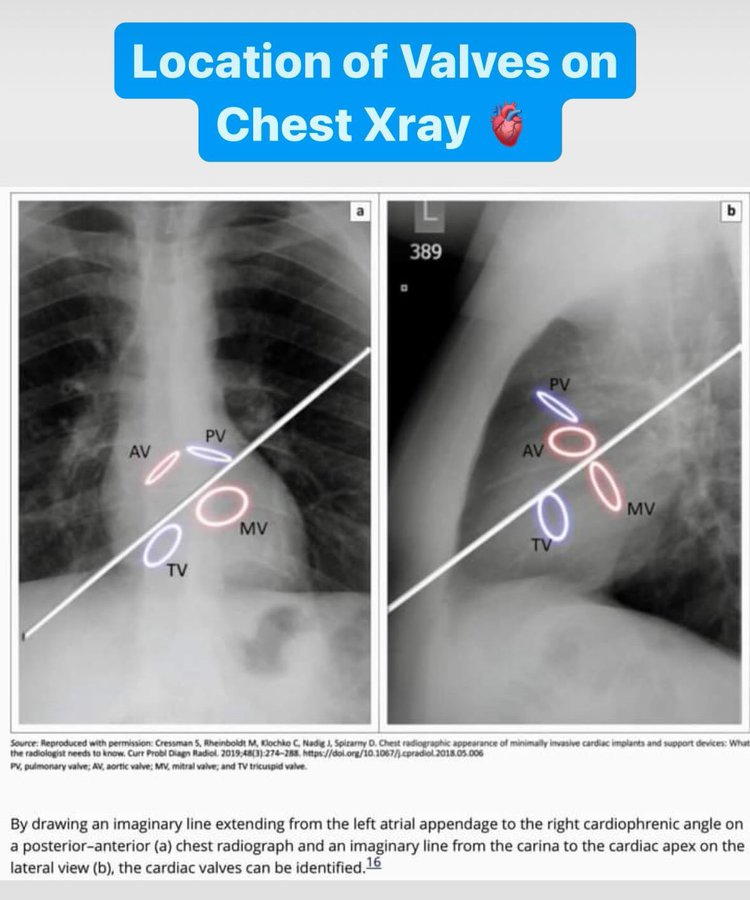
Cardiac valve locations on chest x-ray
- Most Anterior/Superior: Pulmonic
- Central/Anterior: Aortic
- Most Posterior: Mitral
- Anterior/Inferior to Mitral: Tricuspid
Cardiac and vascular function curves
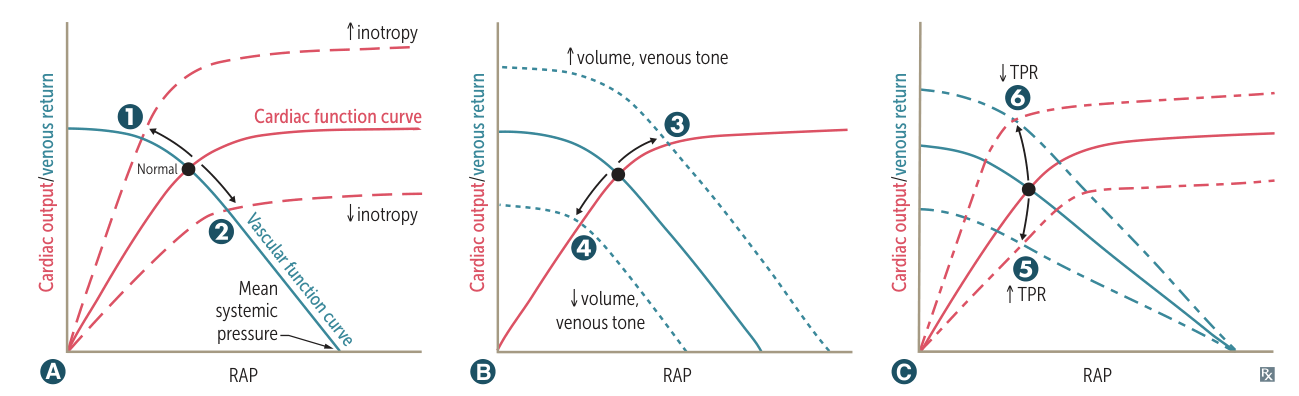
- Y-Axis: Cardiac Output (CO) or Venous Return (VR).
- X-Axis: Right Atrial Pressure (RAP) / Preload.
- Intersection Point: The steady-state operating point where CO = VR.
A. Changes in Inotropy (Contractility)
Referencing Graph A
- Affected Curve: Cardiac Function Curve (Red).
- Vascular Curve: Unchanged.
- Increased Inotropy (Shift Up/Left)
- Mechanism: Stroke volume for a given preload.
- Causes: Catecholamines (Sympathetic stimulation), Digoxin, Exercise.
- Result: CO, RAP.
- Decreased Inotropy (Shift Down/Right)
- Mechanism: Heart muscle cannot pump effectively; fluid backs up.
- Causes: Decompensated Heart Failure (Systolic dysfunction), Narcotic overdose, Myocardial Infarction, Beta-blockers/CCBs.
- Result: CO, RAP.
B. Changes in Blood Volume or Venous Tone
Referencing Graph B Slope is
- Affected Curve: Vascular Function Curve (Blue).
- Cardiac Curve: Unchanged.
- Key Concept: Mean Systemic Filling Pressure (MSFP) is the X-intercept (where the blue line touches the X-axis). It represents the pressure in the system if the heart stops.
- Increased Volume / Venous Tone (Shift Right/Up)
- Mechanism: Increases MSFP.
- Causes: IV Fluids, Transfusion, Sympathetic venoconstriction (increases tone).
- Result: CO, RAP.
- Decreased Volume / Venous Tone (Shift Left/Down)
- Mechanism: Decreases MSFP.
- Causes: Hemorrhage, Dehydration, Venodilators (e.g., Nitrates).
- Result: CO, RAP.
C. Changes in Total Peripheral Resistance (TPR)
Referencing Graph C
- Affected Curve: BOTH curves rotate.
- Key Concept: Changes in TPR alter the slope of the vascular curve but generally do not change the MSFP (X-intercept).
- Increased TPR (Vasoconstriction)
- Cardiac Curve: Rotates down ( Afterload makes it harder to pump).
- Vascular Curve: Rotates down/left (Arteriolar constriction resists blood flow back to the heart).
- Causes: Vasopressors (Phenylephrine), Hypertension.
- Result: CO, RAP stays relatively similar (or slight decrease).
- Decreased TPR (Vasodilation)
- Cardiac Curve: Rotates up ( Afterload makes it easier to pump).
- Vascular Curve: Rotates up/right (Less resistance allows faster return of blood).
- Causes: Exercise, AV Fistula (classic USMLE example), Sepsis (early).
- Result: CO, RAP.